Use Case

Comprehensive Analytical Dashboard for KPI Monitoring

Built an end-to-end N8N + Python data pipeline feeding a live Retool dashboard — eliminating manual data exports and giving the team a single source of truth for all KPIs.

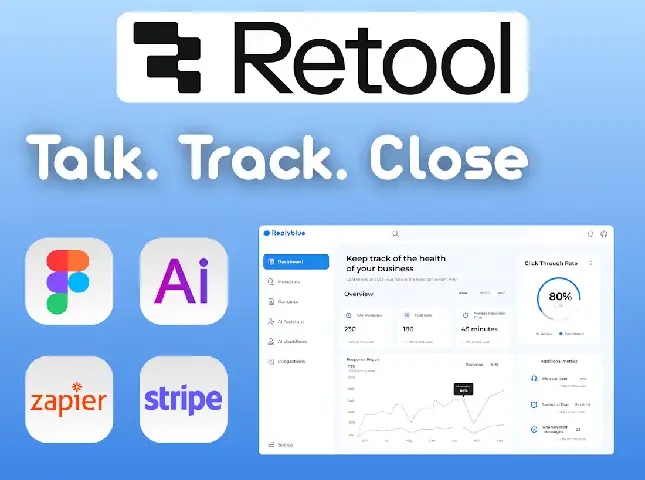
Retool logo next to a badge labeled Agency Partner with a blue checkmark.
Case Study
KPI Monitor
Industry
Analytics & Operations
Platform
Retool
Type
Analytical dashboard

Business Outcomes

Increased decision-making speed by 40%

Reduced manual reporting time by 60%

Improved sales performance tracking by 35%

Enhanced productivity gap identification by 50%

Established a scalable analytics framework

Client Intro

Challenges

Data Integration: Multiple data sources lacked cohesion.

Manual Reporting: Time-consuming and prone to errors.

Scalability: Existing system couldn't handle growing data.

Real-time Insights: Delayed data processing hindered decisions.

Performance Monitoring: Inefficient tracking of KPIs.

Cost Analysis: Difficulty in identifying cost inefficiencies.

Sales Performance: Incomplete view of sales metrics.

User Adoption: Resistance to new technology implementation.

Solution

The solution involved creating an analytical dashboard that consolidates diverse datasets into a single platform, offering real-time insights and facilitating swift, informed decisions by highlighting key performance trends and inefficiencies.

Data Consolidation: Integrated various data sources into a unified view.

Real-time Processing: Enabled instant access to up-to-date information.

KPI Visualization: Simplified complex data into intuitive charts.

Automated Reporting: Eliminated manual report generation.

Scalable Framework: Designed for future data and KPI integration.

User-Friendly Interface: Ensured ease of use for all stakeholders.

Performance Alerts: Set up notifications for critical KPI changes.

Sales Trend Analysis: Provided comprehensive sales metric insights.

Technology Stack

Frontend: Retool, custom UI components

Backend: AWS, PostgreSQL

Data Processing: Python

Visualization: D3.js

Design: Figma

Real Estate & Construction
Replaced disconnected spreadsheets with a centralized CRM -cutting client lookup time by 40%, doubling recruitment data processing, and giving leadership real-time project visibility.
Read moreIkonik Icon
Logistics
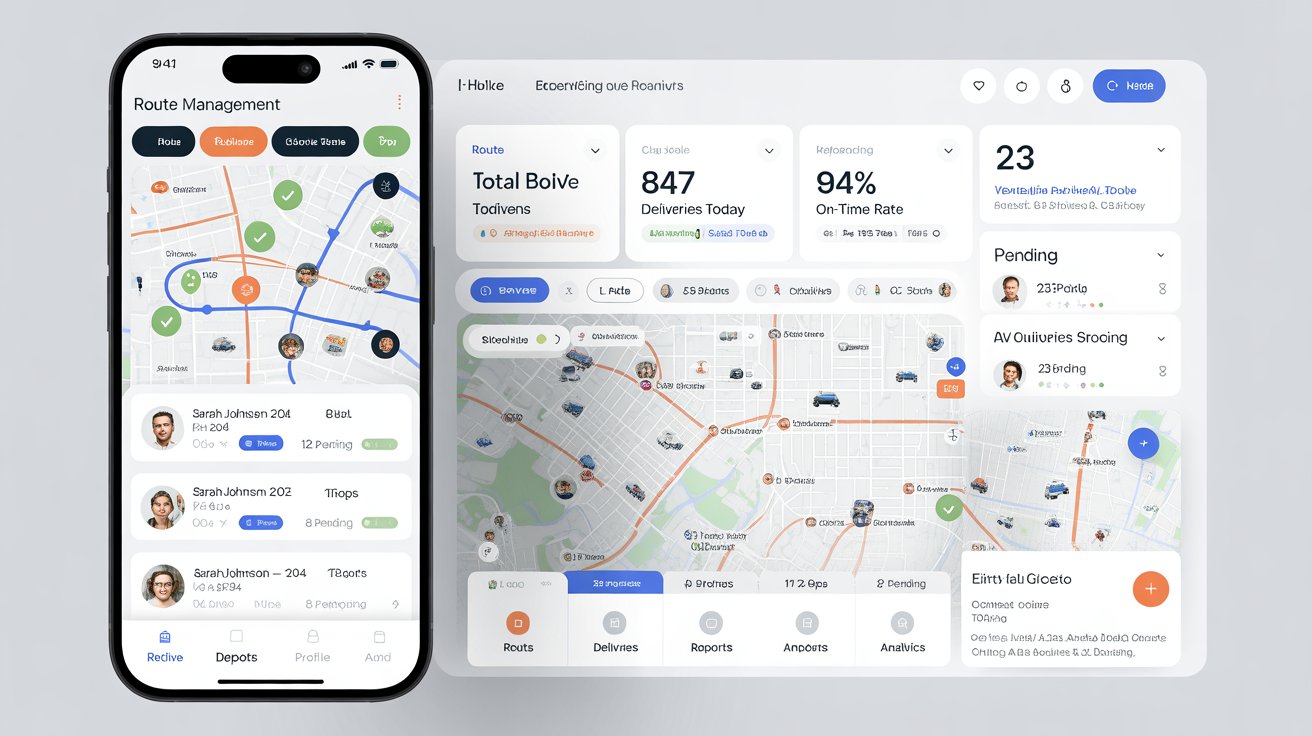
Transforming delivery operations with a custom app for seamless route management and real-time reporting.
Read moreIkonik Icon
Telecoms & ISP
Designed the full PostgreSQL database architecture from scratch, then built a multi-tab admin panel centralizing user management, content, transactions, and media for a growing ISP.
Read moreIkonik Icon
We are here to help you

Are you ready to optimize efficiency and drive growth?
Get in touch today.

Contact us
graph of growthgross volume
retool-table
Contact
LinkedInYouTube